Visualizing Node Metrics
Recent versions of Substrate expose metrics, such as how many peers your node is connected to, how much memory your node is using, etc. To visualize these metrics, you can use tools like Prometheus and Grafana.
Note: In the past Substrate exposed a Grafana JSON endpoint directly. This has been replaced with a Prometheus metric endpoint.
A possible architecture could look like:
+-----------+                     +-------------+                                                              +---------+
| Substrate |                     | Prometheus  |                                                              | Grafana |
+-----------+                     +-------------+                                                              +---------+
      |               -----------------\ |                                                                          |
      |               | Every 1 minute |-|                                                                          |
      |               |----------------| |                                                                          |
      |                                  |                                                                          |
      |        GET current metric values |                                                                          |
      |<---------------------------------|                                                                          |
      |                                  |                                                                          |
      | `substrate_peers_count 5`        |                                                                          |
      |--------------------------------->|                                                                          |
      |                                  | --------------------------------------------------------------------\    |
      |                                  |-| Save metric value with corresponding time stamp in local database |    |
      |                                  | |-------------------------------------------------------------------|    |
      |                                  |                                         -------------------------------\ |
      |                                  |                                         | Every time user opens graphs |-|
      |                                  |                                         |------------------------------| |
      |                                  |                                                                          |
      |                                  |       GET values of metric `substrate_peers_count` from time-X to time-Y |
      |                                  |<-------------------------------------------------------------------------|
      |                                  |                                                                          |
      |                                  | `substrate_peers_count (1582023828, 5), (1582023847, 4) [...]`           |
      |                                  |------------------------------------------------------------------------->|
      |                                  |                                                                          |
Reproduce diagram
Go to: https://textart.io/sequence
object Substrate Prometheus Grafana
note left of Prometheus: Every 1 minute
Prometheus->Substrate: GET current metric values
Substrate->Prometheus: `substrate_peers_count 5`
note right of Prometheus: Save metric value with corresponding time stamp in local database
note left of Grafana: Every time user opens graphs
Grafana->Prometheus: GET values of metric `substrate_peers_count` from time-X to time-Y
Prometheus->Grafana: `substrate_peers_count (1582023828, 5), (1582023847, 4) [...]`
Step 0: Install Prometheus and Grafana
Step 1: Run your node
Substrate exposes an endpoint which serves metrics in the Prometheus exposition
format available on port
9615. You can change the port with --prometheus-port <PORT> and enable it to
be accessed over an interface other than local host with
--prometheus-external.
./substrate
Step 2: Retrieve the metrics
In a second terminal run:
curl localhost:9615/metrics
Which should return a similar output to:
# HELP substrate_block_height_number Height of the chain
# TYPE substrate_block_height_number gauge
substrate_block_height_number{status="best"} 12591
substrate_block_height_number{status="finalized"} 11776
substrate_block_height_number{status="sync_target"} 1236089
# HELP substrate_cpu_usage_percentage Node CPU usage
# TYPE substrate_cpu_usage_percentage gauge
substrate_cpu_usage_percentage 98.90908813476563
# HELP substrate_memory_usage_bytes Node memory usage
# TYPE substrate_memory_usage_bytes gauge
substrate_memory_usage_bytes 195504
# HELP substrate_network_per_sec_bytes Networking bytes per second
# TYPE substrate_network_per_sec_bytes gauge
substrate_network_per_sec_bytes{direction="download"} 4117
substrate_network_per_sec_bytes{direction="upload"} 437
# HELP substrate_peers_count Number of network gossip peers
# TYPE substrate_peers_count gauge
substrate_peers_count 3
# HELP substrate_ready_transactions_number Number of transactions in the ready queue
# TYPE substrate_ready_transactions_number gauge
substrate_ready_transactions_number 0
Step 3: Configure Prometheus to scrape your Substrate node
In a prometheus.yml configuration file, configure Prometheus to scrape the exposed endpoint by adding it to the targets array.
scrape_configs:
  # The job name is added as a label `job=<job_name>` to any timeseries scraped from this config.
  - job_name: 'substrate_node'

    # Override the global default and scrape targets from this job every 5 seconds.
    scrape_interval: 5s

    static_configs:
      - targets: ['127.0.0.1:9615']
Launch a Prometheus instance with the prometheus.yml config file.
./prometheus --config.file prometheus.yml
Step 4: Visualizing Prometheus metrics with Grafana
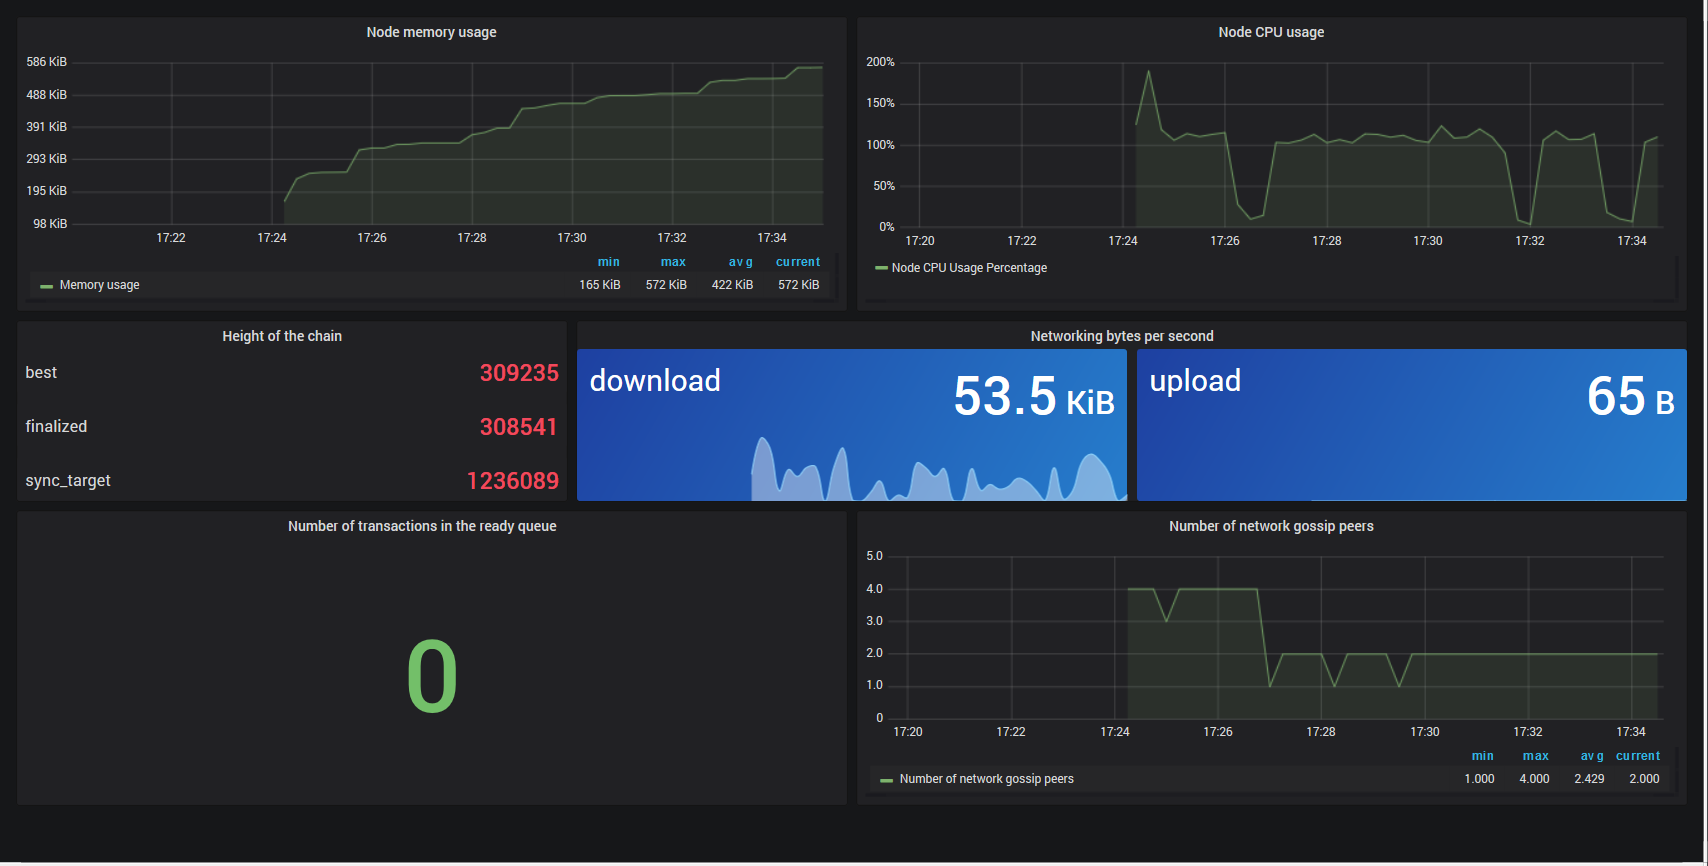
You can use the above dashboard for visualizing metrics in Grafana or you can create your own. The prometheus docs may be helpful here.
Next Steps
Learn More
- Learn how to set up a private Substrate network.
Examples
- Take a look at the Grafana dashboard configuration for the Polkadot network.
References
- Visit the source code for Substrate Prometheus Exporter.